FungiBio CASE HISTORIES

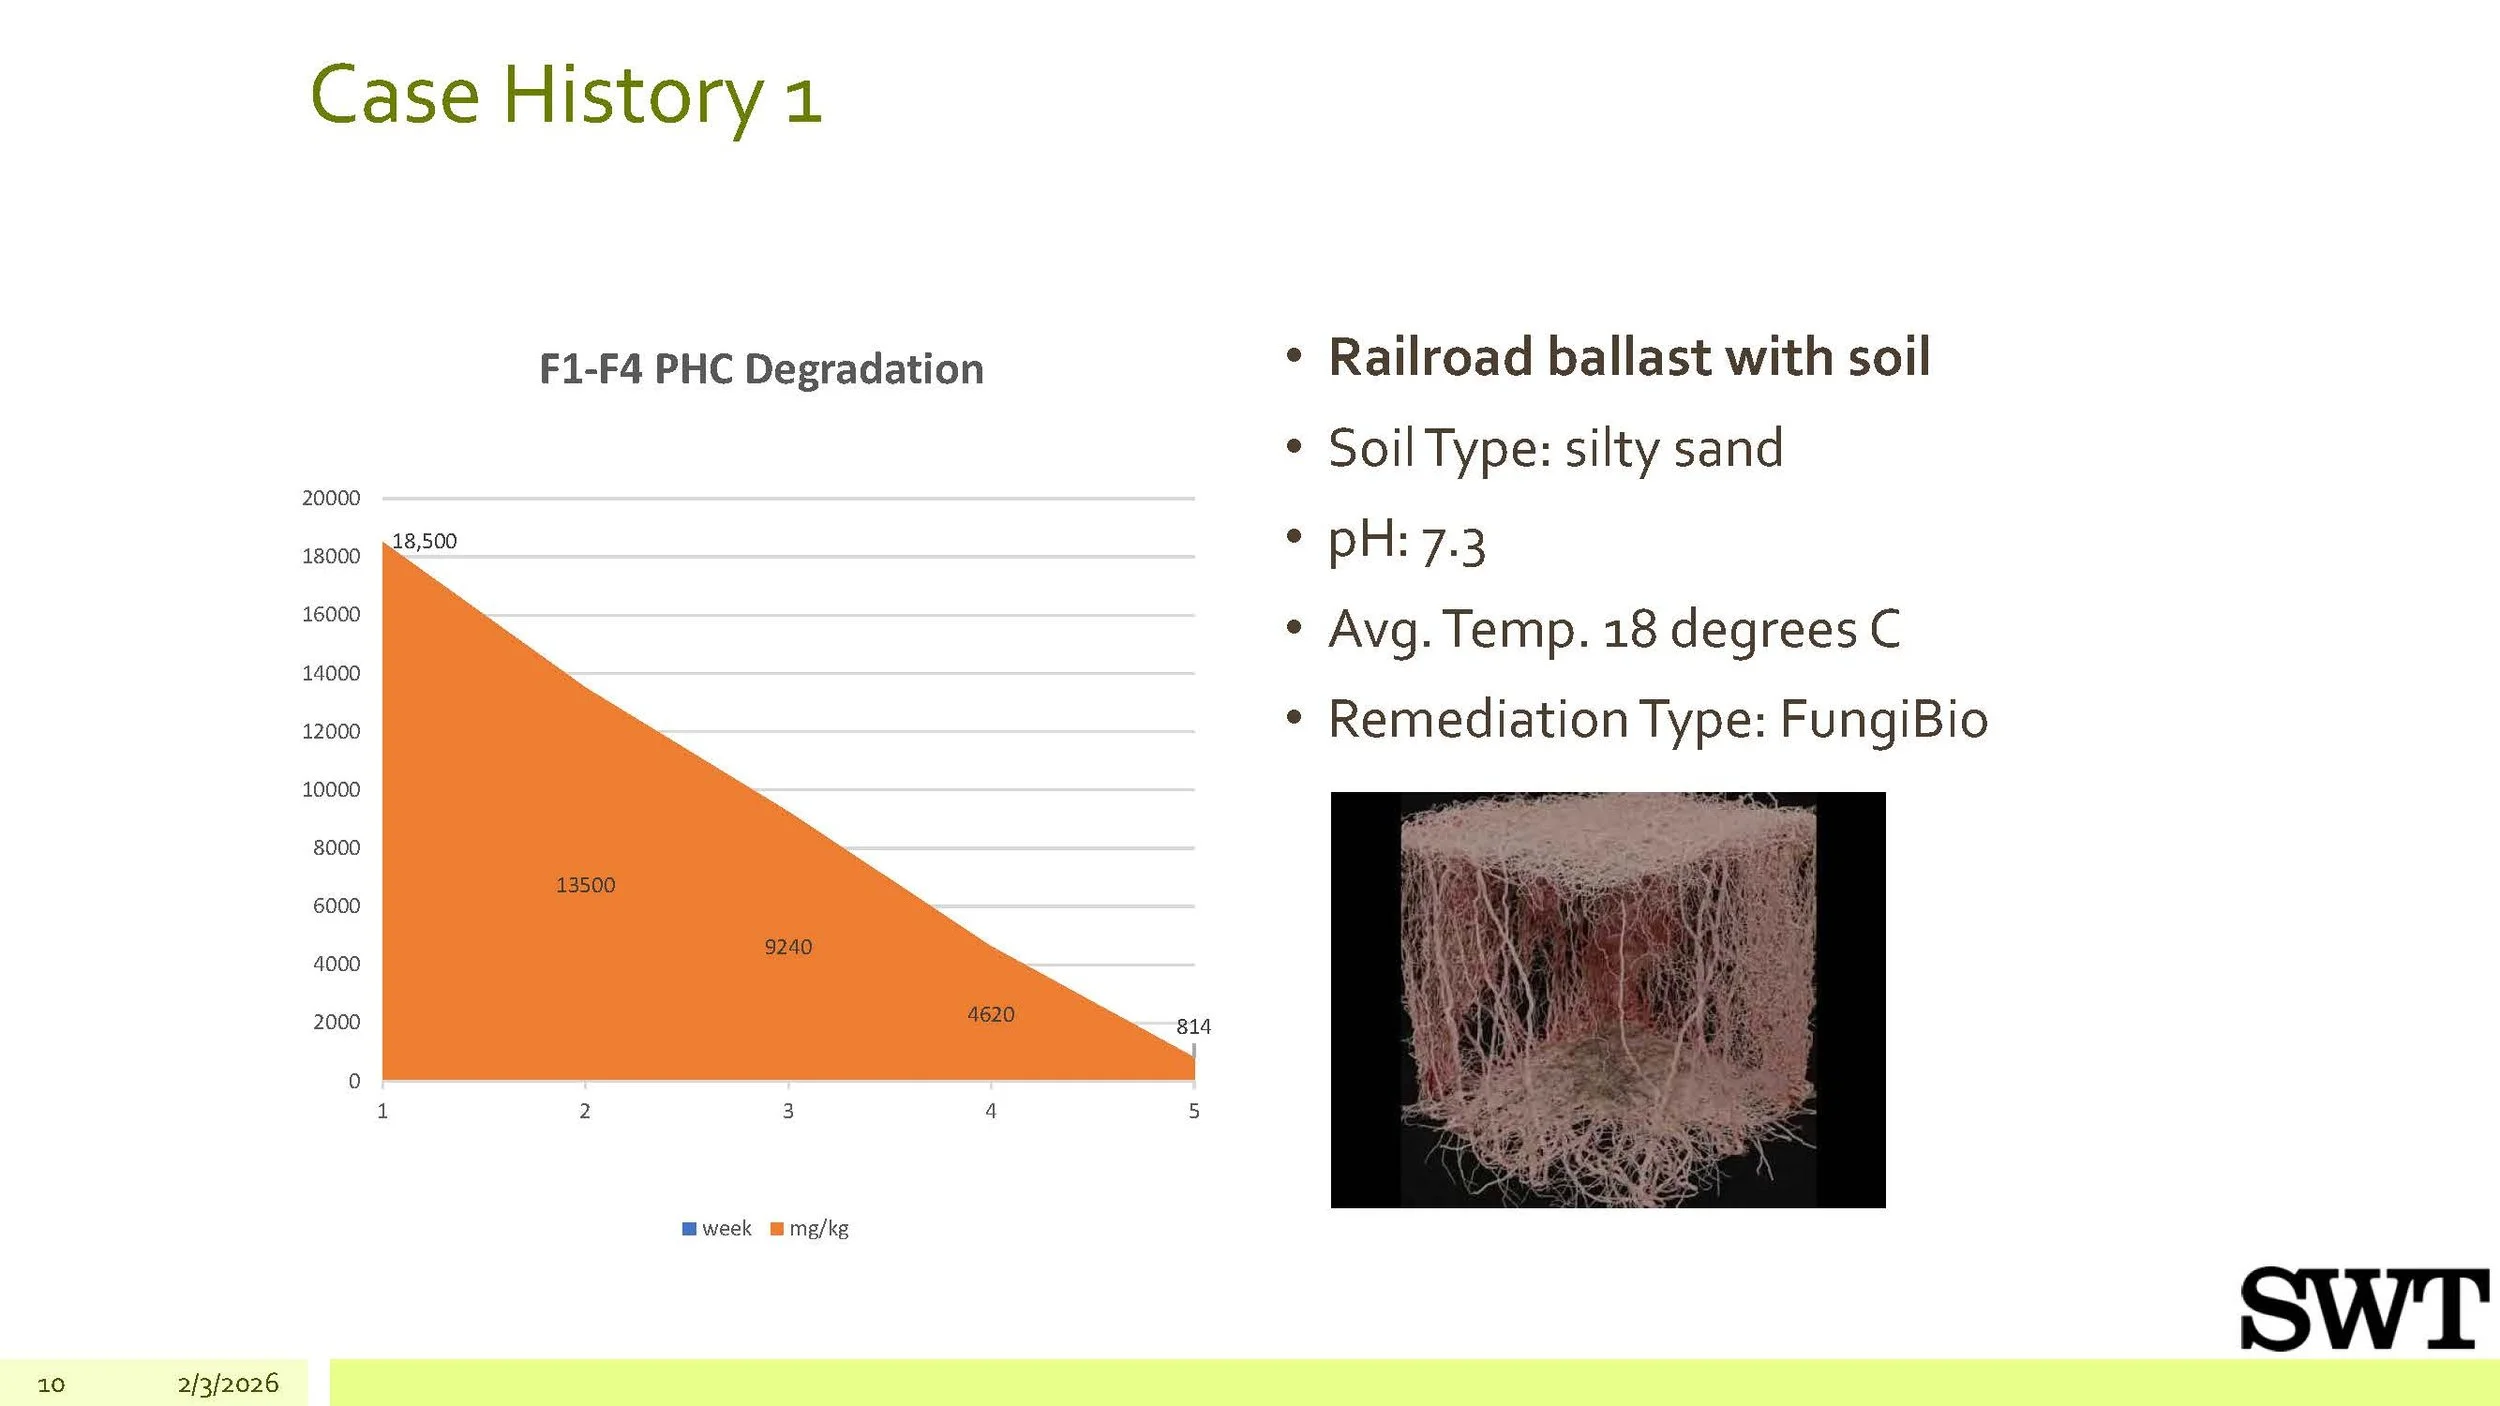
A presentation slide titled 'Case History 1' showing a chart labeled 'F1-F4 PHC Degradation' with data points decreasing from 18,500 to 814. To the right, bullet points describe a railroad ballast with soil, silty sand, pH 7.3, an average temperature of 18 degrees Celsius, and a remediation type called FungiBio. There is also an image of a root-like structure beneath the text.
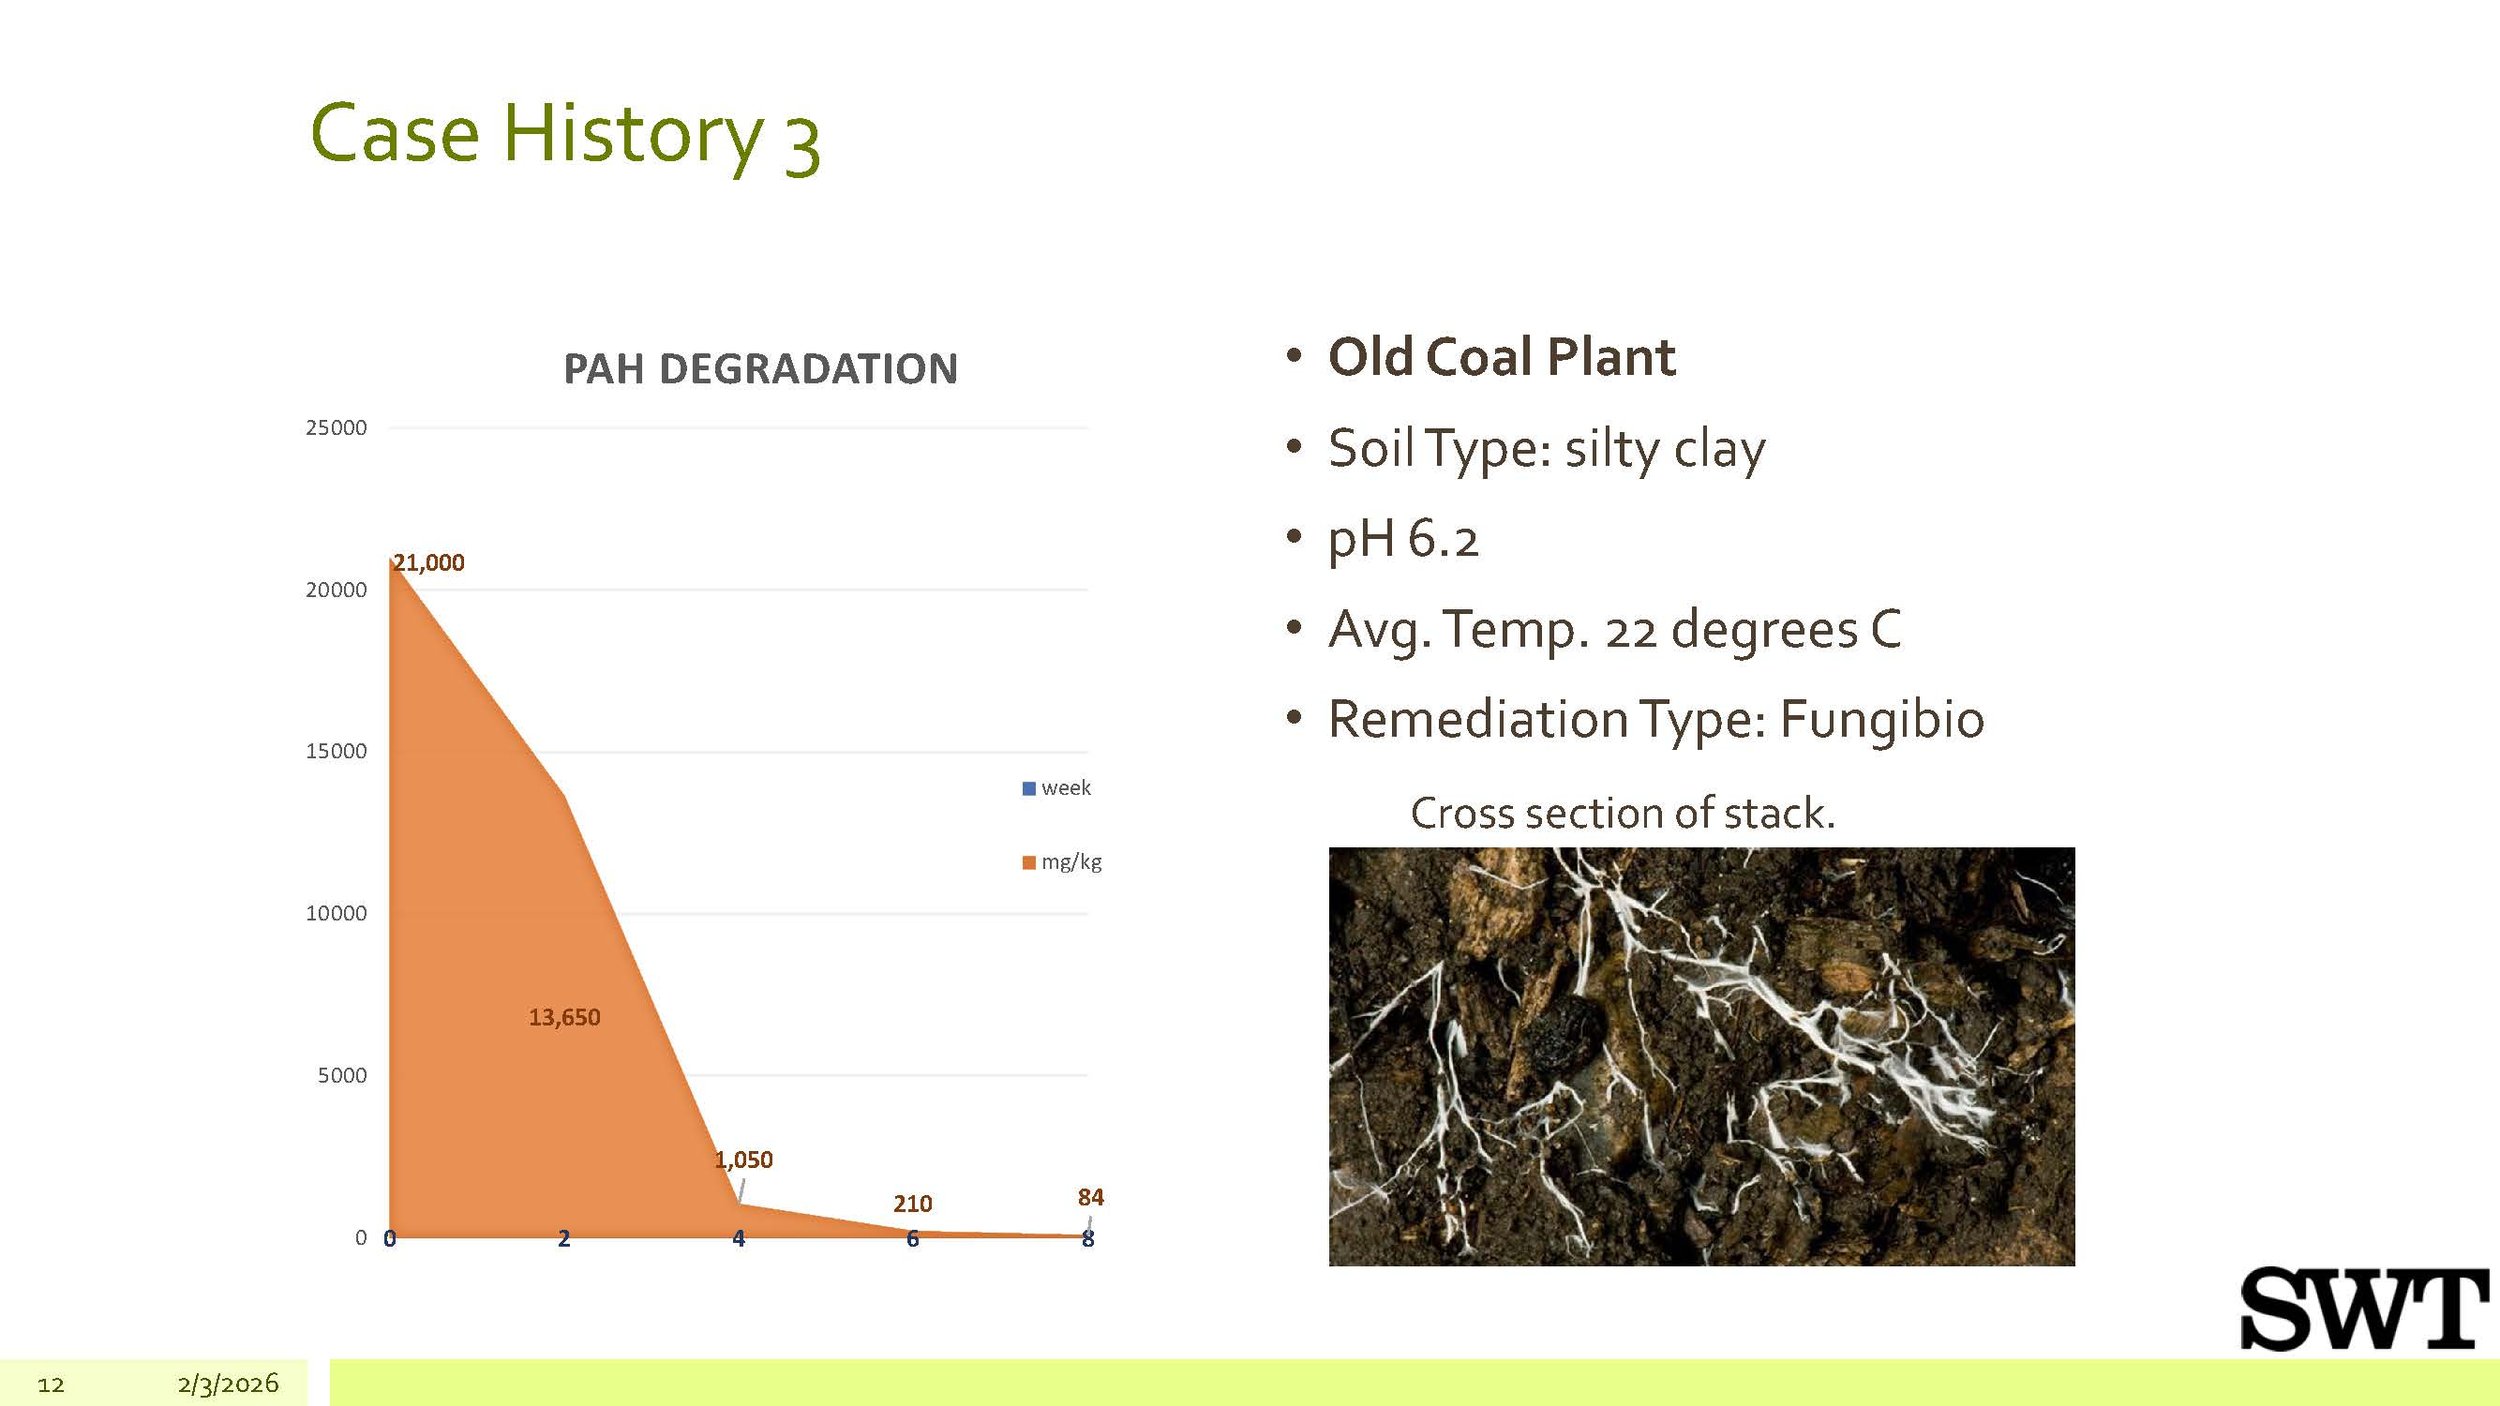
Part of a presentation slide titled 'Case History 3' showing a graph labeled 'PAH Degradation' with data points, and a bulleted list about an old coal plant, soil type, pH, temperature, and remediation type, along with an image of plant roots in soil at the bottom.
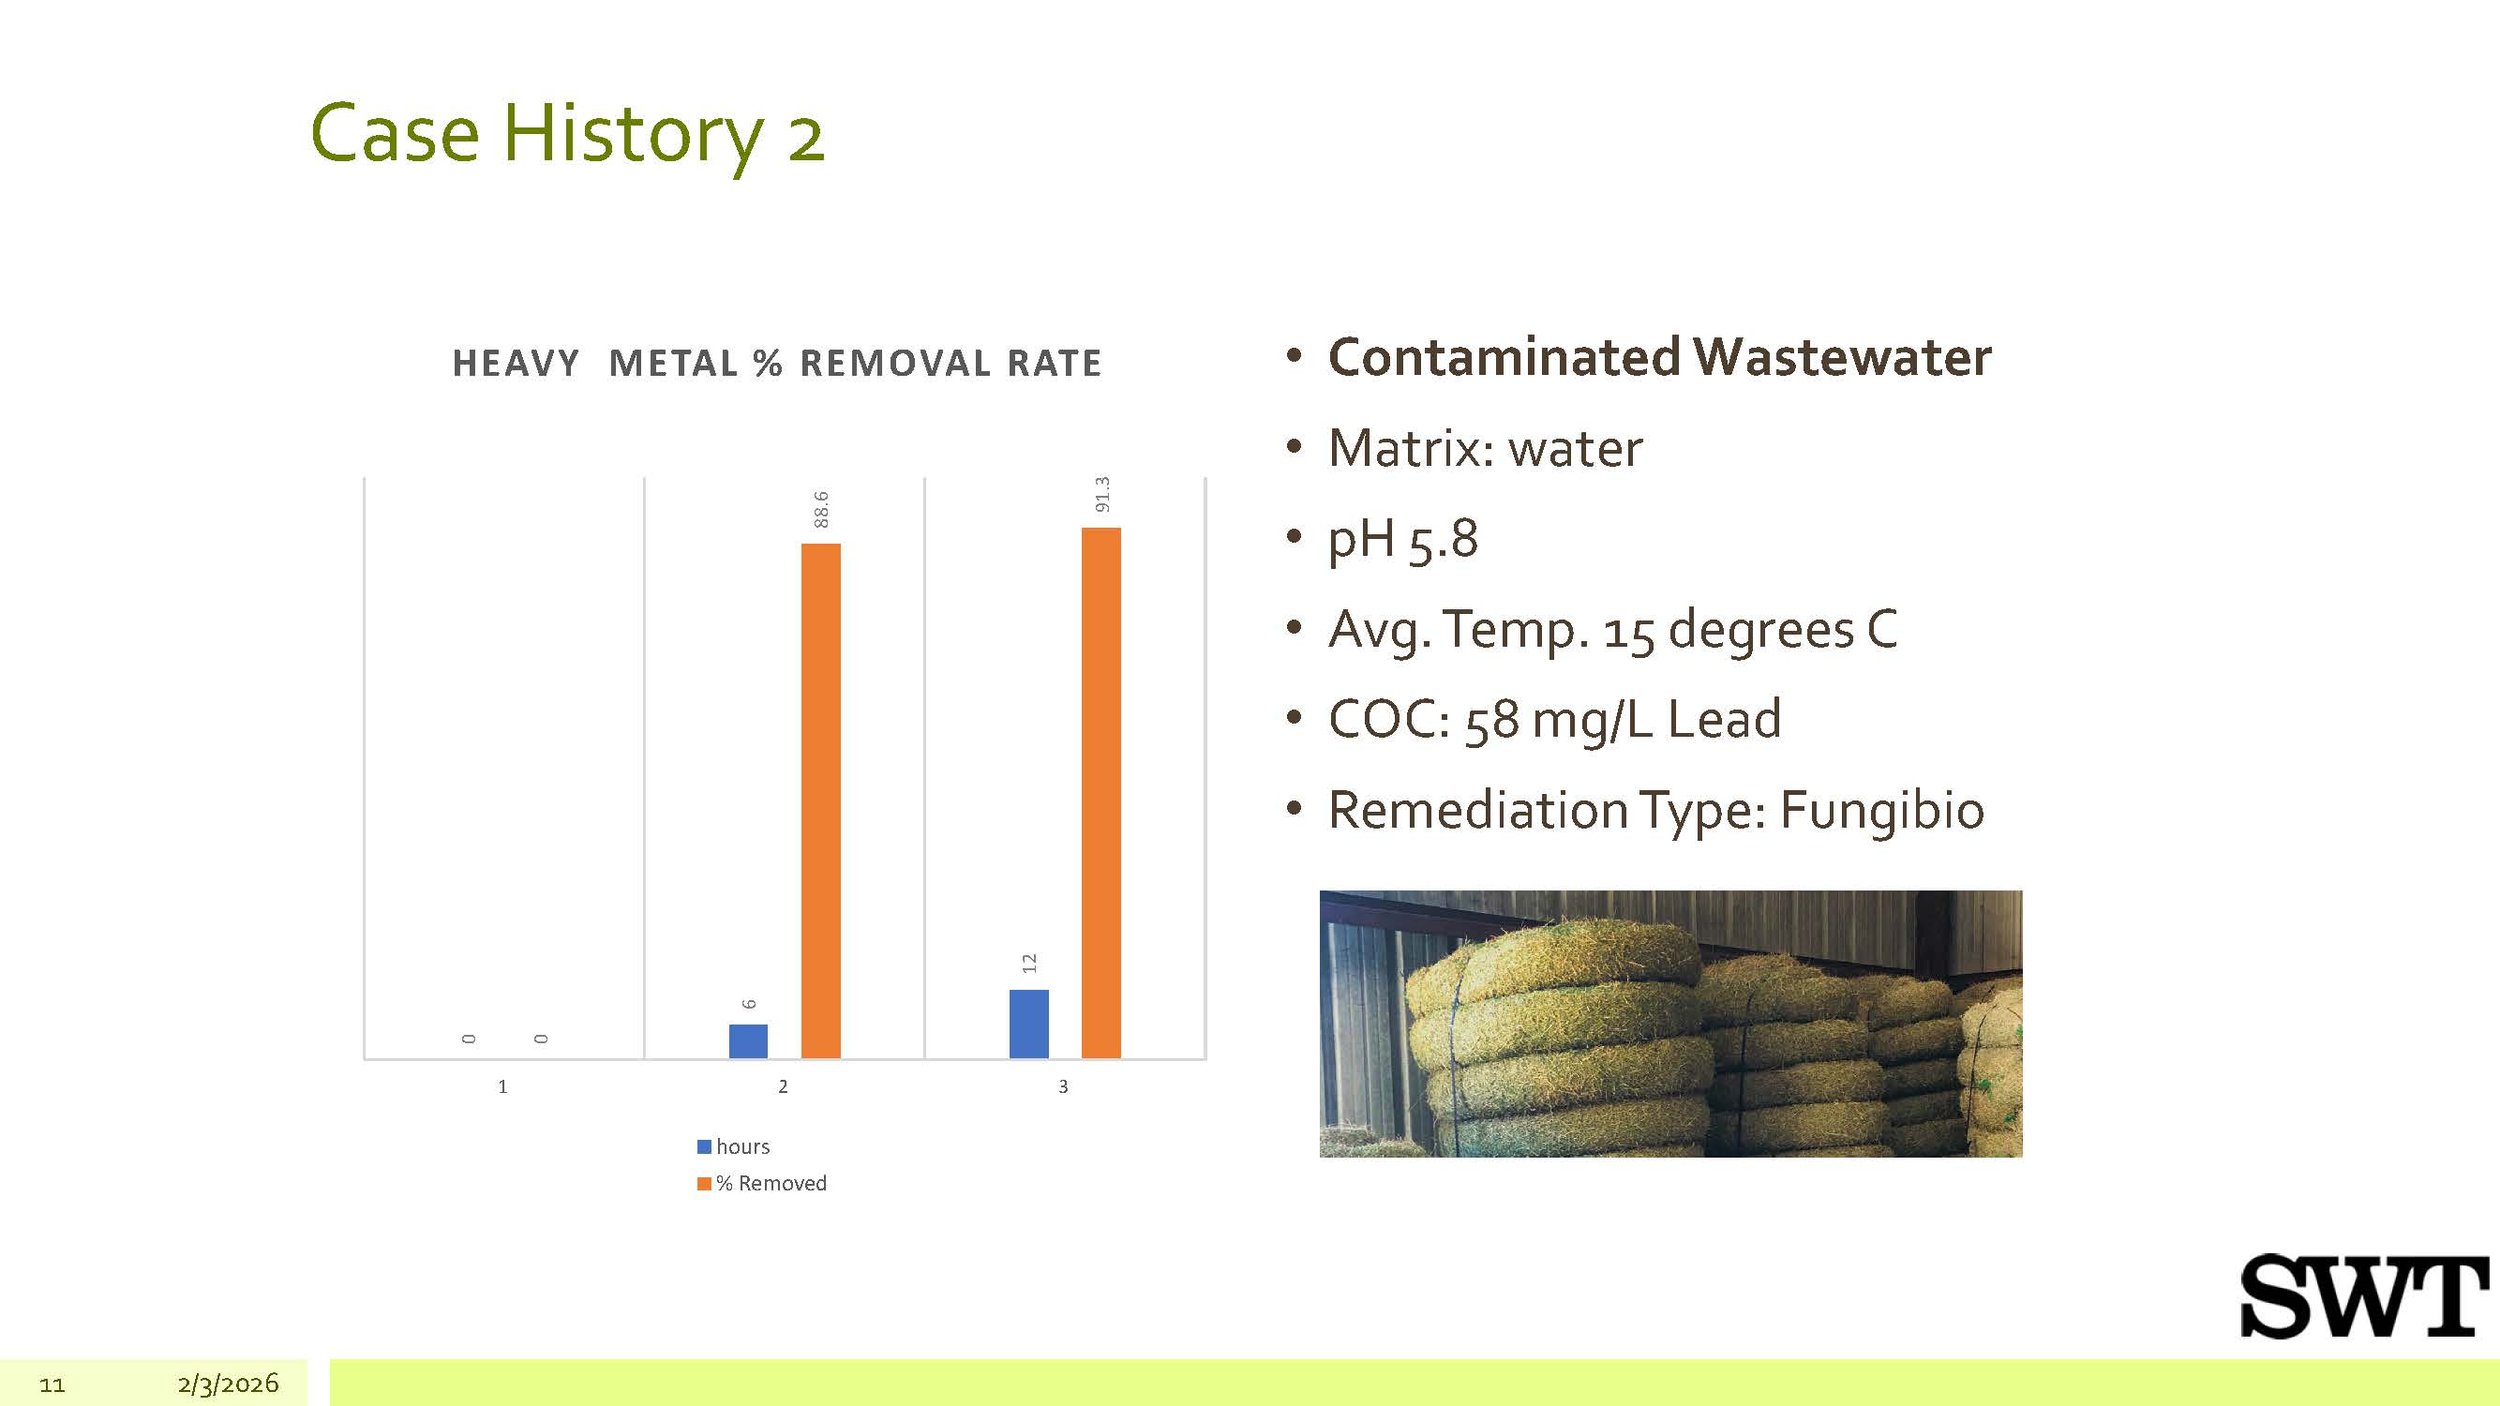
Slide titled 'Case History 2' showing a line graph with vertical blue and orange bars, and text about contaminated wastewater treatment, pH level, temperature, lead concentration, and remediation with fungi. A photo of hay bales tied with string stacked against a wooden building is also visible.